Supply
Get help with your water supply queries and questions.
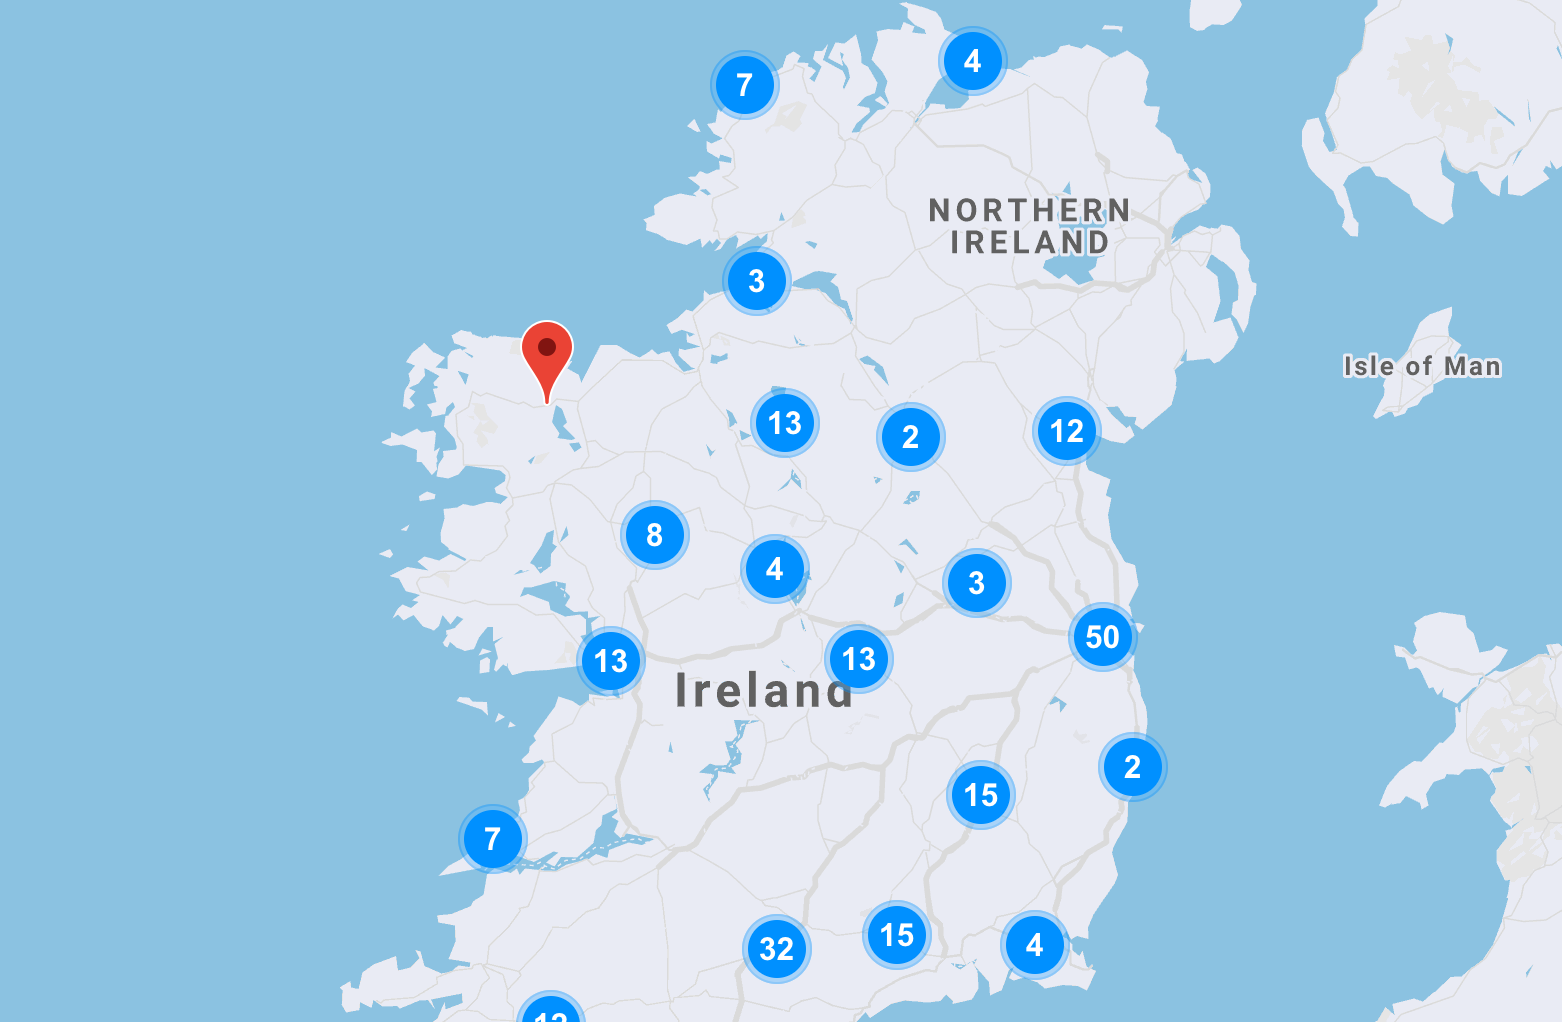
Supply and Service Updates
Are you experiencing low pressure, water outages or other supply issues? Check the water supply alerts for your area.

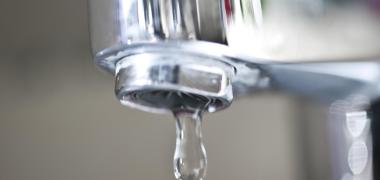


Customer Support Videos
View our series of helpful videos for advice on what to do if you experience water related issues in your home.
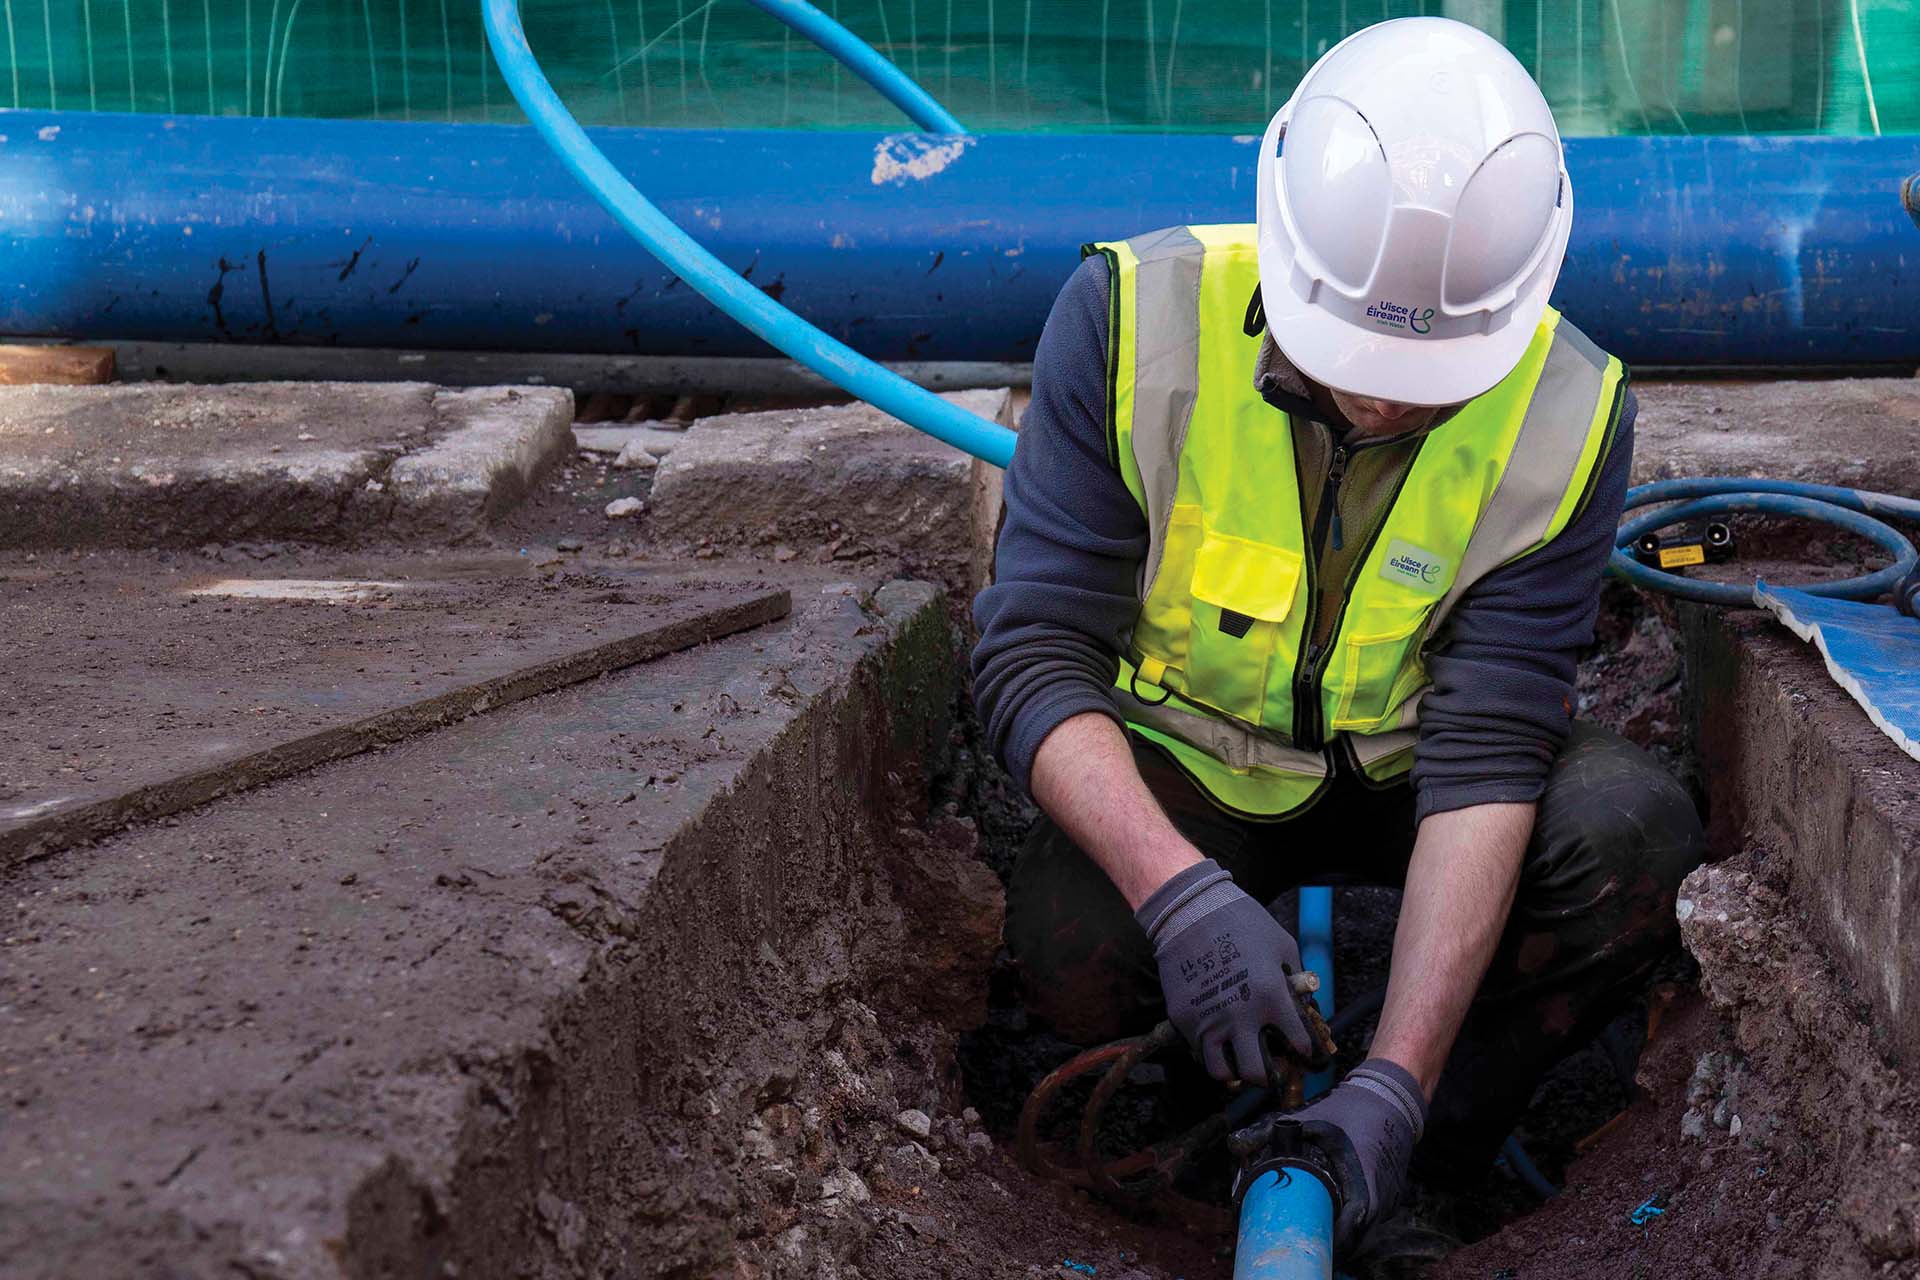
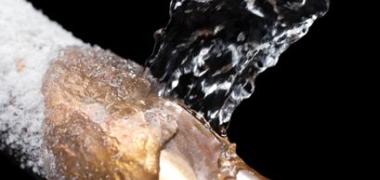
Prepare for planned works
Before planned works take place, follow these steps to help avoid issues with your water supply.
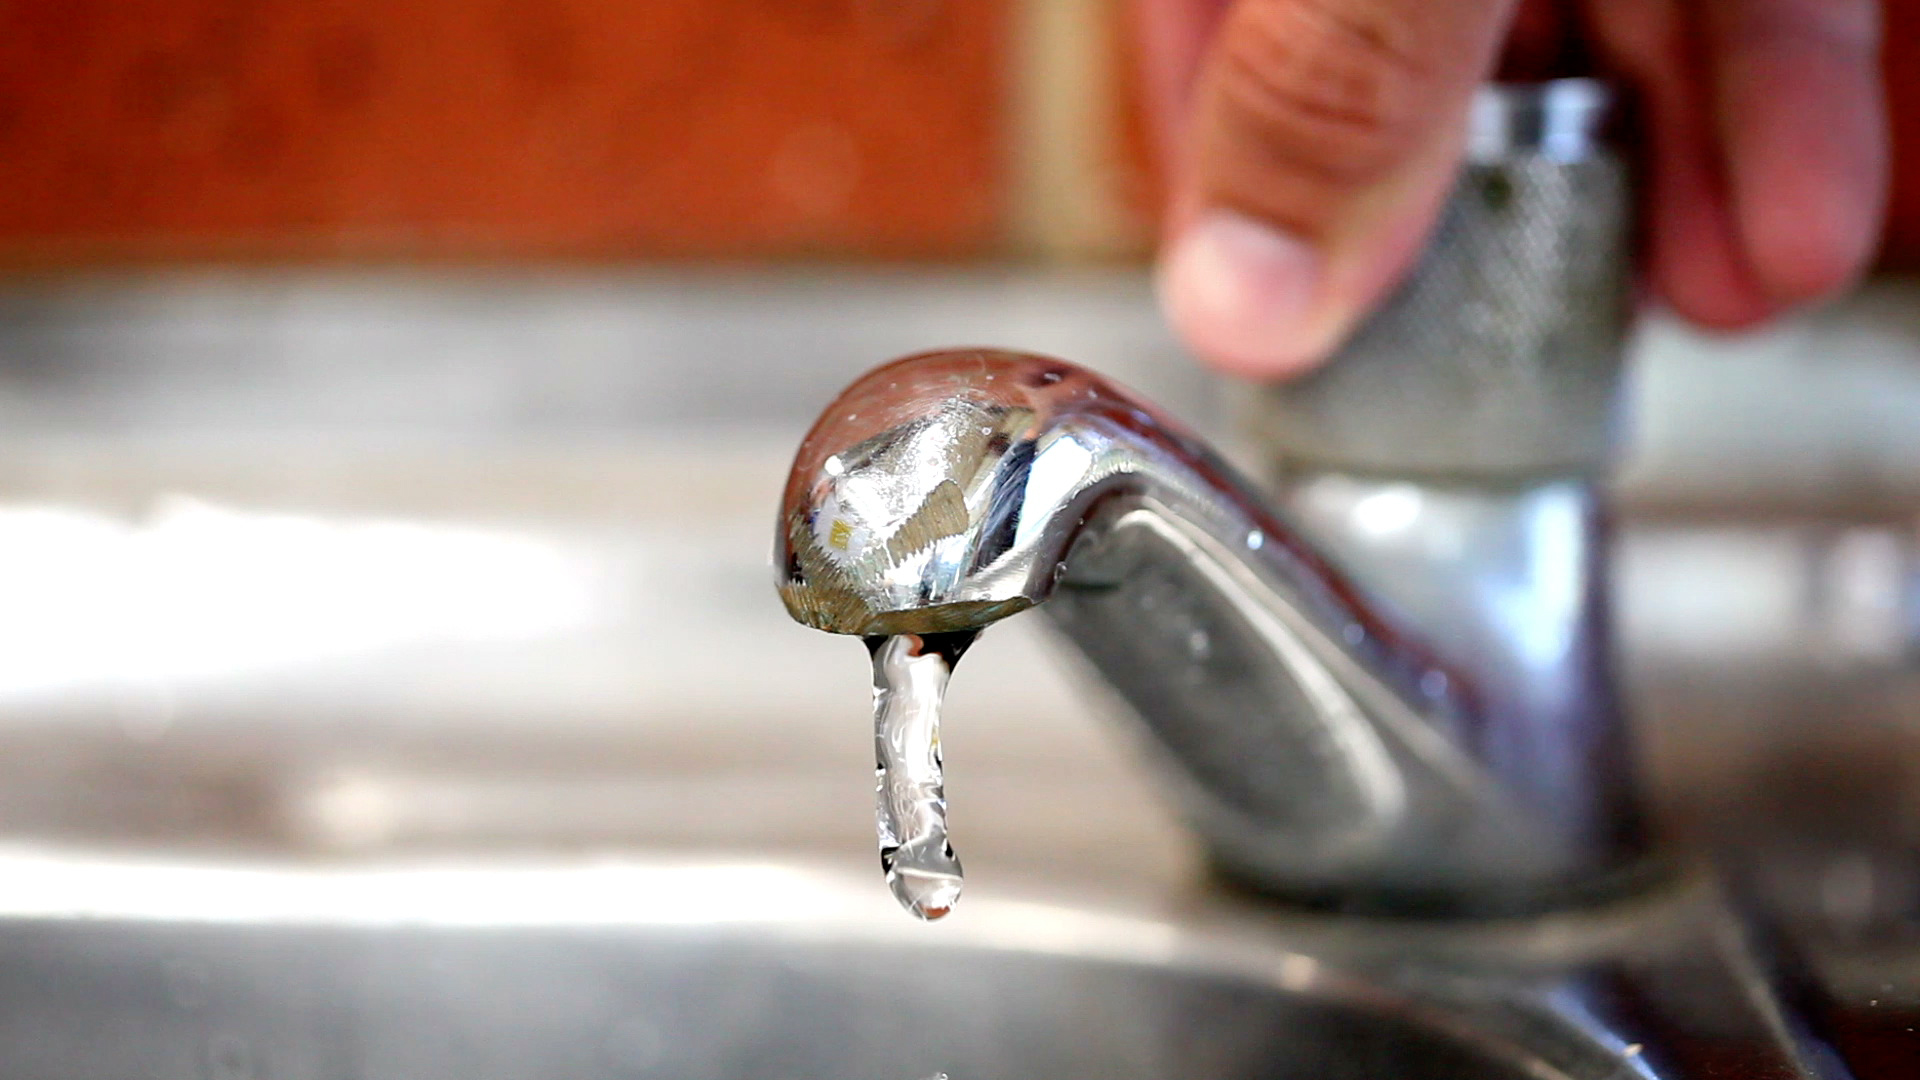
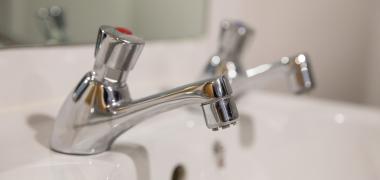
Turn off water supply
The inside stop valve controls the water supply entering your home. Find out how to use it to turn your water supply on or off.
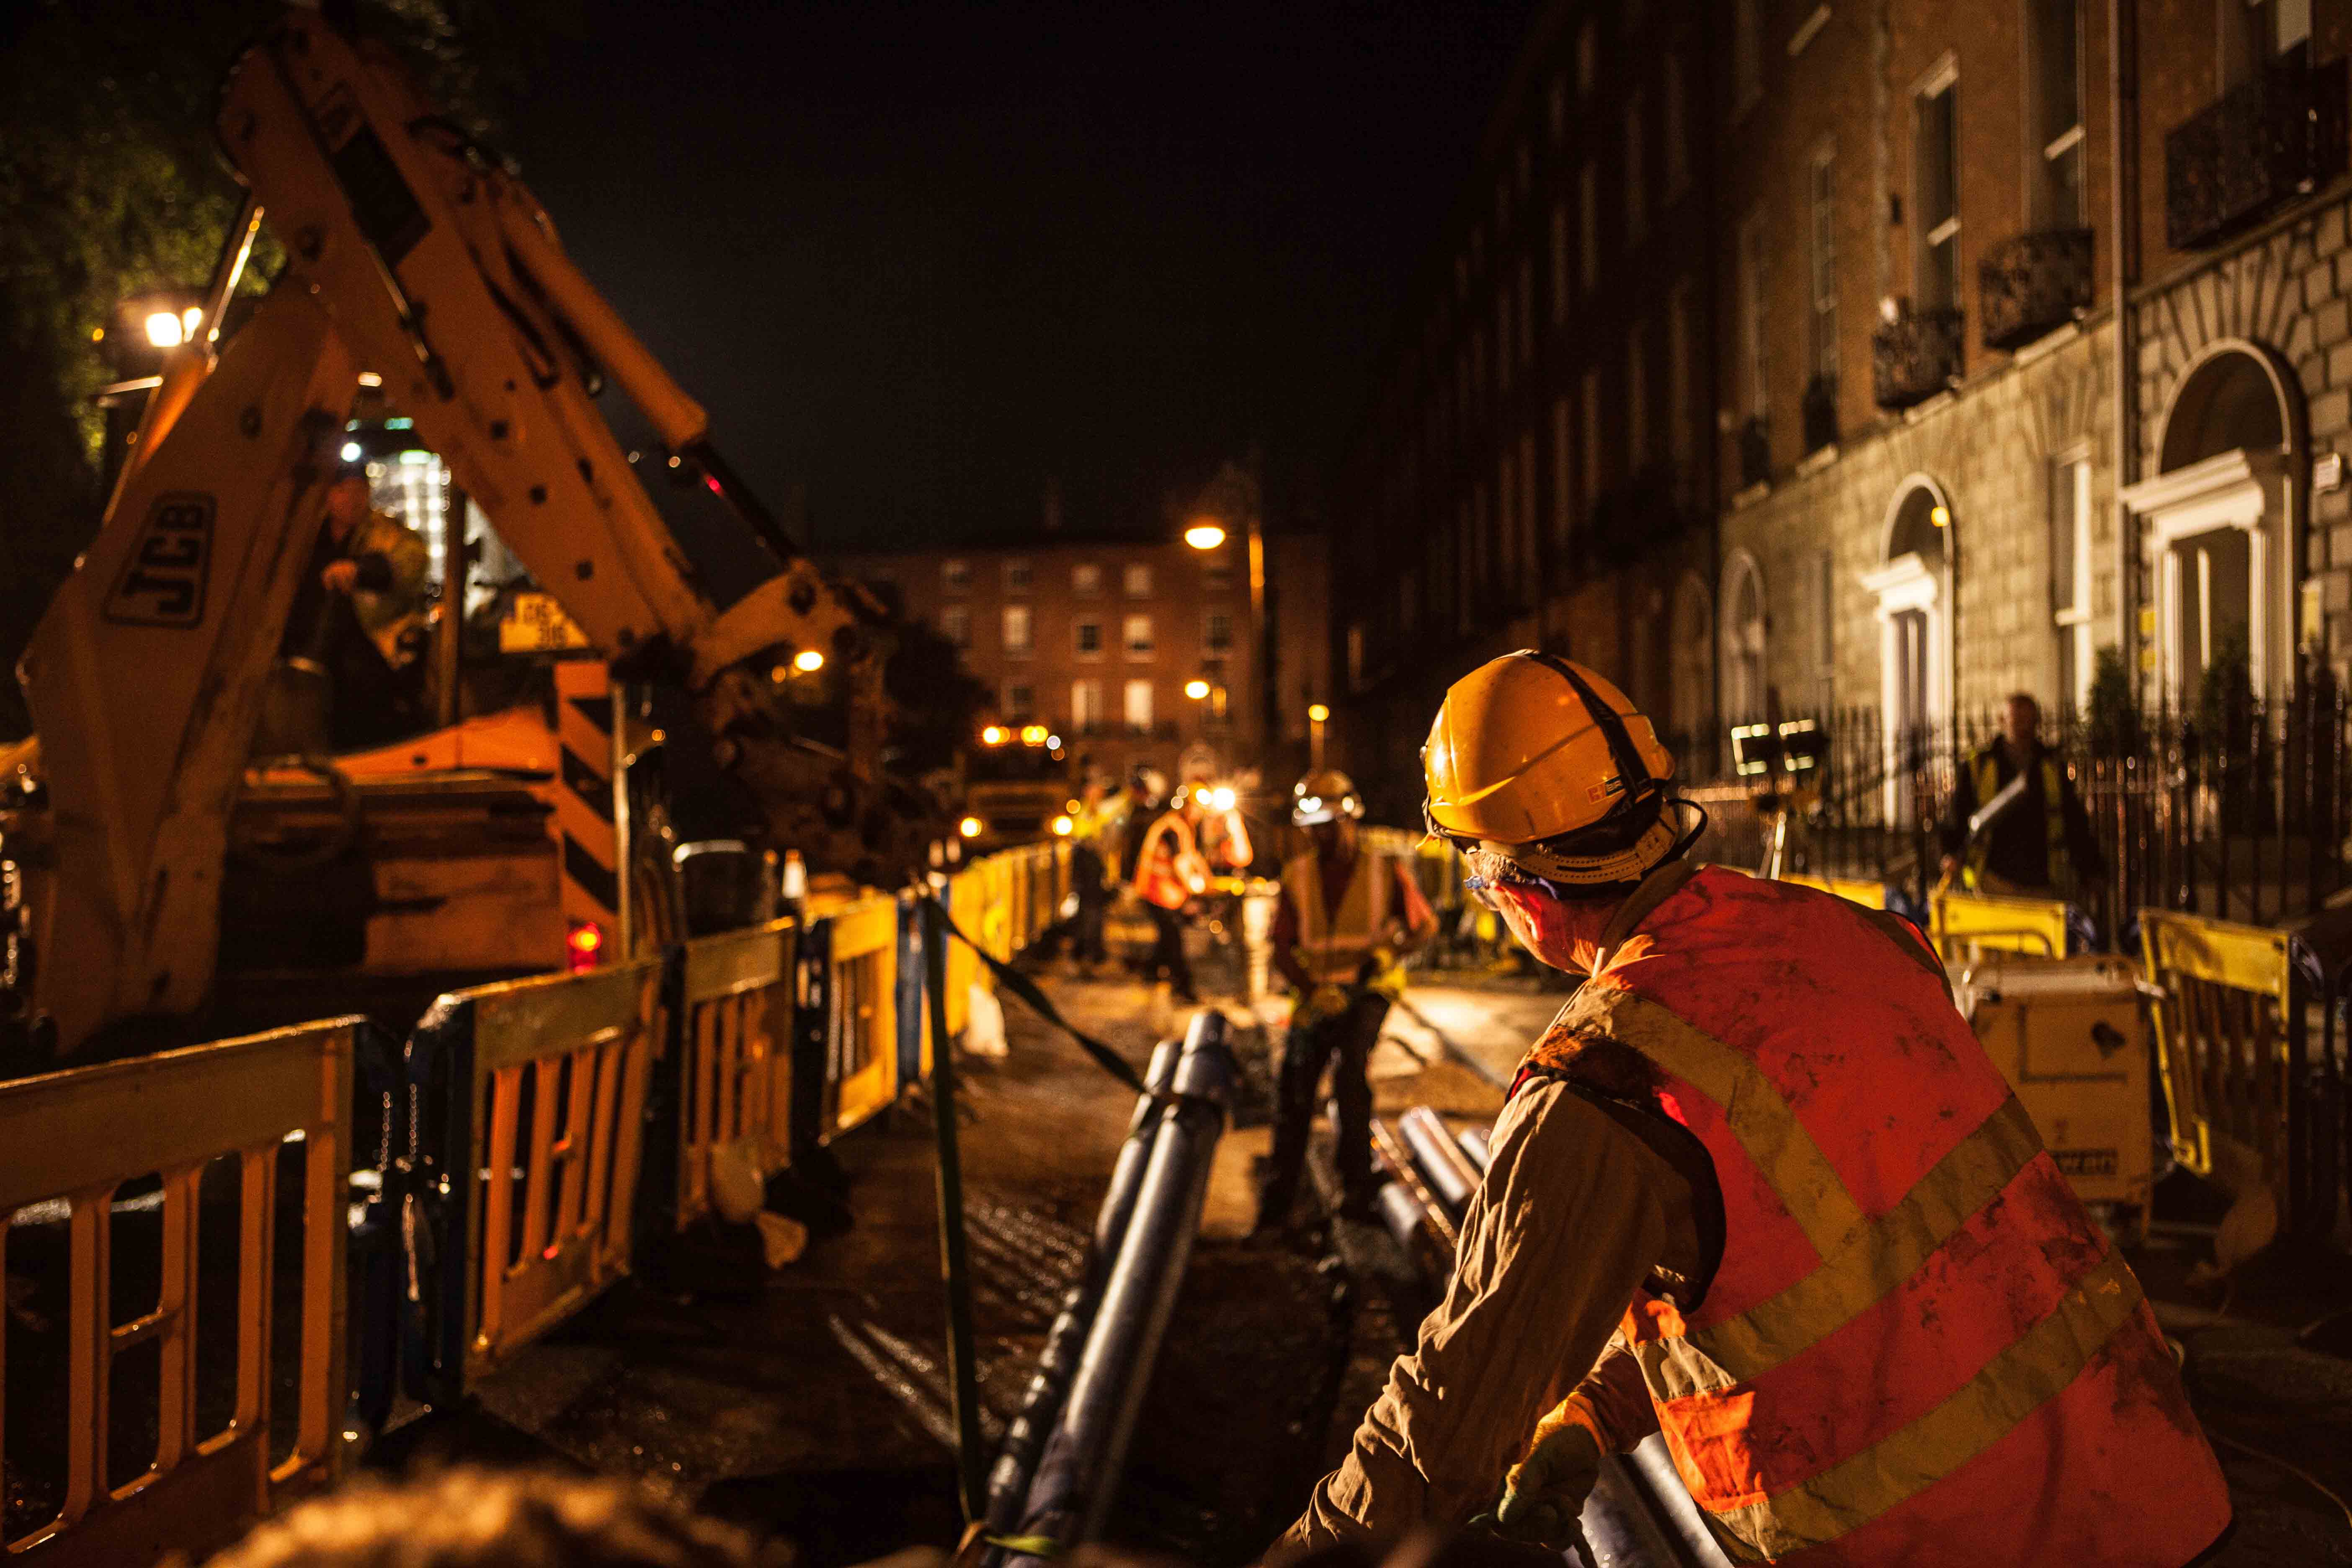
Incident management and emergency response
We have a robust Incident and Crisis Management Framework in place, allowing us to quickly respond to unplanned and emergency events.
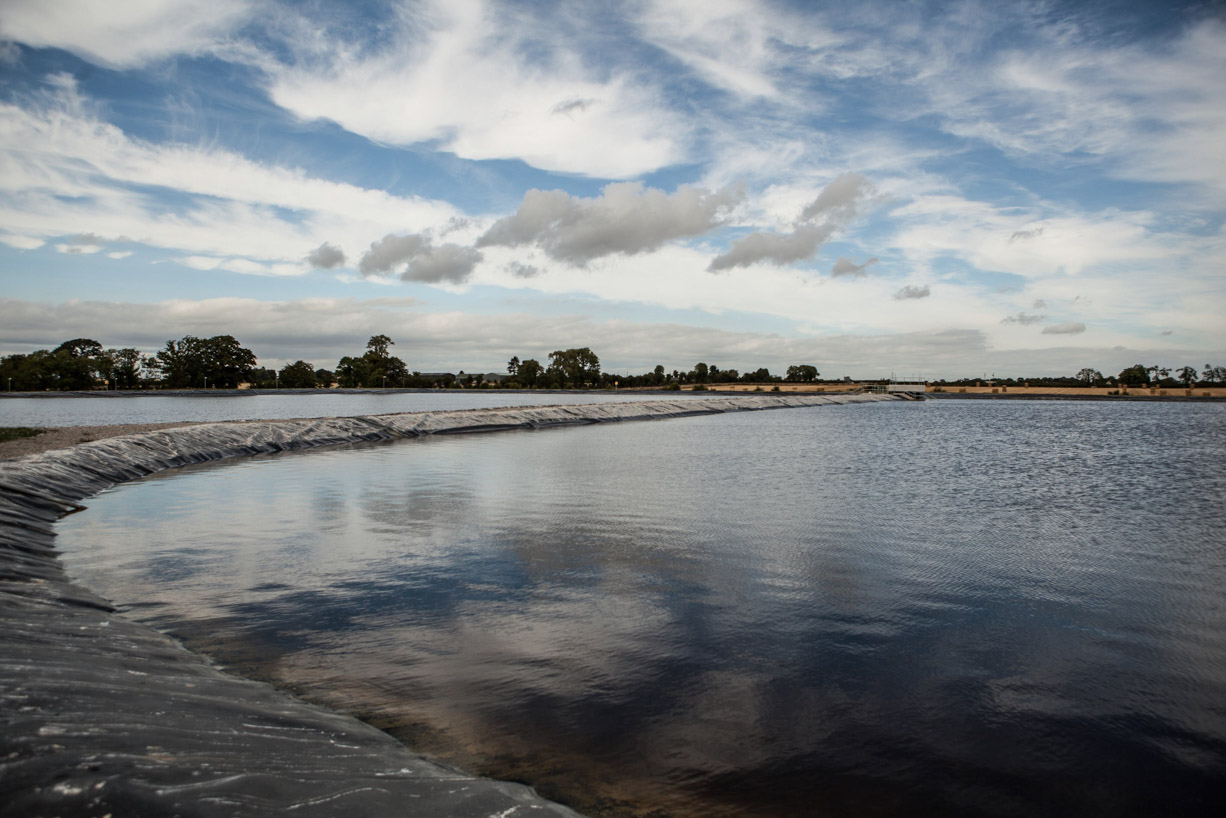
Water Shortages & Restrictions
We need regular rainfall throughout the year, especially during winter, to build up our water supplies. Learn how Uisce Éireann works to conserve, protect and manage your supply.
Group Water Schemes
Uisce Éireann provides water and wastewater services to customers through the public water and sewerage schemes. Group Water Schemes are privately owned and operated schemes.
Cloud to Glass
Drinking, cooking, washing, bathing - we use water in so many ways. The water we use starts as raw water in rivers and lakes. It undergoes a complex treatment process so we can enjoy clean, safe drinking water every day. Follow the journey from cloud to glass.